- Company
- Business Plan
- Sample Business Plans
- Steps & Timeline
- Work at a Glance
- Market Research at a Glance
- Overview
- Investor Business Plan
- Bank Business Plan
- Strategic Business Plan
- Nonprofit Business Plan
- Franchise Business Plan | Business plan template ppt
- L-1 Business Plan
- E-2 Business Plan
- EB-5 Business Plan
- EB-5 Regional Centers
- Merge and Acquisition Business Plan (M&A)
- Private Placement Memorandums (PPM)
- Professional Feasibility Study
- PowerPoint Presentations
- Pitch Deck Presentation Services
- Market Research
- Plan
- Build
- Fund
- Shop
- Contact Us
- Talk to Us 1-800-496-1056
Printing and Photocopy
Business Plan Sample
Fill the Form to Download Printing and Photocopy Business Plan Example
Starting a 3D printing business or other types of printing business has many benefits. It is very easy to get started with a very low investment from your home, or you can increase its size depending on your investment.
In order to launch this business successfully, you will need to prepare comprehensive printing and photocopy business plan which will lay the foundations for future business operations and decisions.
If you are wondering how to write one, then here is a printing and photocopy business plan sample to help you write your own.
Executive Summary
Thinktank will be a business service provider based in Miami, Florida. Founded by Mrs. Cindy Smith, Thinktank will offer a variety of business services including postal, shipping, faxing, and copying to the local residents. While these services will comprise the initial market entry core, long-term plans call for the integration of storage and relocation capabilities to the business mix. The local area has been in dire need of a service of this type for some time and Thinktank plans to adequately serve them through the consistent delivery of real-time business solutions.
The market is definitely filled with opportunities but in order to capitalize on them, a strong infusion of working capital must acquiesce. The founder projects needing 100K for their business venture with repayment being made out of the profits that are driven annually. Funding that is secured will be used in a variety of areas including marketing, logistics, management, site procurement as well as the day-to-day operations of the organization.
To read the complete executive summary click here
Useful Resource: How to write an executive summary for a business plan
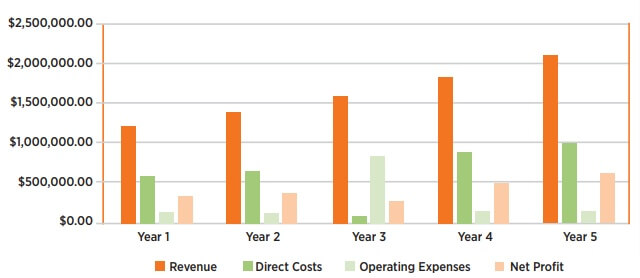
Financial Highlights
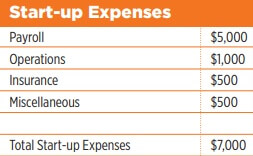
Startup Summary
Industry at a Glance
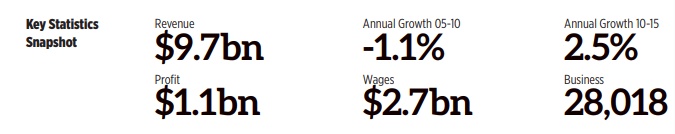
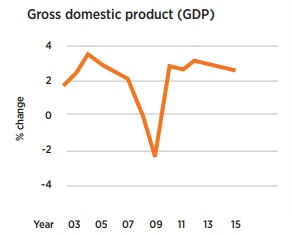
Key External Drivers
Industry activity is mostly affected by the level of outsourcing of non-core activities. A growing trend of outsourcing administration functions has resulted in significant growth in revenue in the past. Although rising competition from other industries is now occurring.
SWOT Analysis
Strengths
1. Location. The location is one of the primary strengths of the Thinktank business model as there are currently no other organizations that have the capabilities to offer the types of services that will be introduced to the market.
Weaknesses
1. Lack of funding. Funding is the sole weakness of the Thinktank business venture. While funding is a weakness it should be noted that the founder is confident that if adequate funding is secured, she will be able to develop a viable, sustainable business.
Opportunities
1. Limited competition. The limited amount of local competition is the primary opportunity for Thinktank as it will give the organization the opportunity to develop a loyal customer base while erecting barriers to entry.
Threats
1. Larger organizations. Larger organizations could possibly realize the opportunities that can be found in the local region and begin entering the market. While this is a threat, the founder believes that with strategic marketing, community efforts and customer service, this threat can for the most part be mitigated.
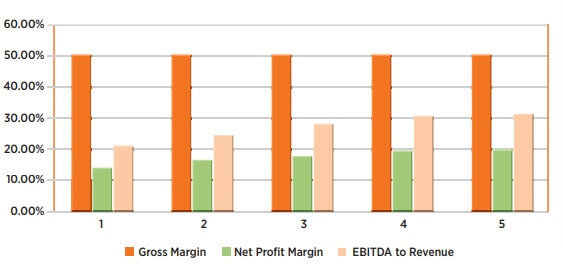
Financial Indicators
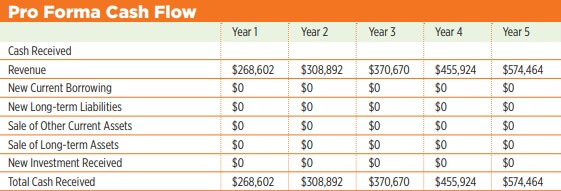
Projected Cash Flow
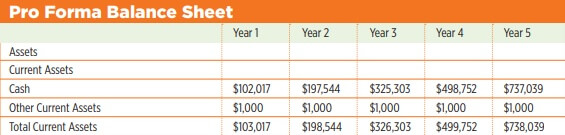
Projected Balance Sheet
Click to view the faxing and printing and photocopy business plan. Our experienced MBA business plan writers professionally write each business plan and work with you to develop a winning plan. Your business plan can look as polished and professional as this sample business plan, we provide real sample business plans free of charge.
Business Plan Sample for Printing and Photocopy Business
Download Printing and Photocopy Business Plan Example PDF
We will show you some real-world business plan examples so you may know how to write your own, especially if you are seeking a bank loan or an outside investment and need to use SBA-approved formatting.


- Business Planning
- Bank Business Plan
- Investor Business Plans
- Franchise Business Plan
- Cannabis Business Plan
- Strategic Business Plan
- M&A Business Plan
- Private Placement
- Feasibility Study
- Pitch Deck
- Pitch Deck
- Market Research
- Sample Business Plans
- Hire a Business Plan Writer
- Business Plan Printing
- Business Valuation Calculator
- Business Plan Examples
- Real Estate Business Plan
- Business Plan Template
- Business Plan Pricing Guide
- Nonprofit Business Plan
- Business Plan Makeover
- Business Funding
- Business E-learning Series
- Business Assets


- 1-800-496-1056

- (613) 800-0227

- +44 (1549) 409190

- +61 (2) 72510077

© Wise Business Plans®. All rights reserved.